Looker lets you schedule periodic delivery of a user-defined dashboard, a Look’s visualization, or a Look’s data.
Customizing Data Deliveries
There are several ways to customize the delivery of your data. You can schedule a periodic delivery, such as delivering a certain dashboard every Monday. For Looks, you can create a schedule, so that information is delivered only if the data has changed since the last delivery, or only if the query yields results. This last option is especially useful if you want to receive any new results as an alert. For example, if your Look has the query “unpaid visits in the past 7 days,” you can receive an alert for only when a result is returned. This will let you know there is an outstanding visit that needs immediate attention. You can also apply filters for your schedule.
Note
You can also immediately send data directly from an Explore, Look, or dashboard with the same destination and formatting options that are available when scheduling data deliveries. This lets you send data right away, without setting up a schedule. In the case of an Explore, you can send a query immediately using all the destination and formatting options, without having to save the query to a dashboard or a Look.
Starting a Schedule
You can create a schedule for dashboards, Looks, and Explores.
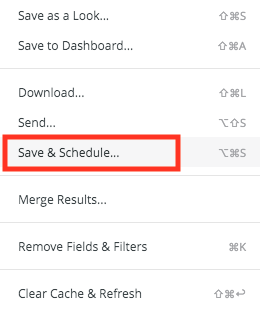
For Explores, click Save & Schedule to save your choices as a Look and then schedule that Look.
For dashboards and Looks, click the gear menu in the upper right and choose Schedule:
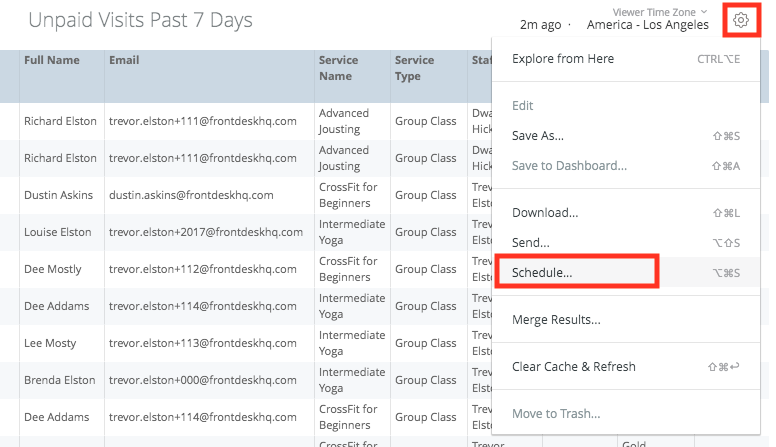
From here, you can choose your delivery method, destination, and format.
Options and Formatting
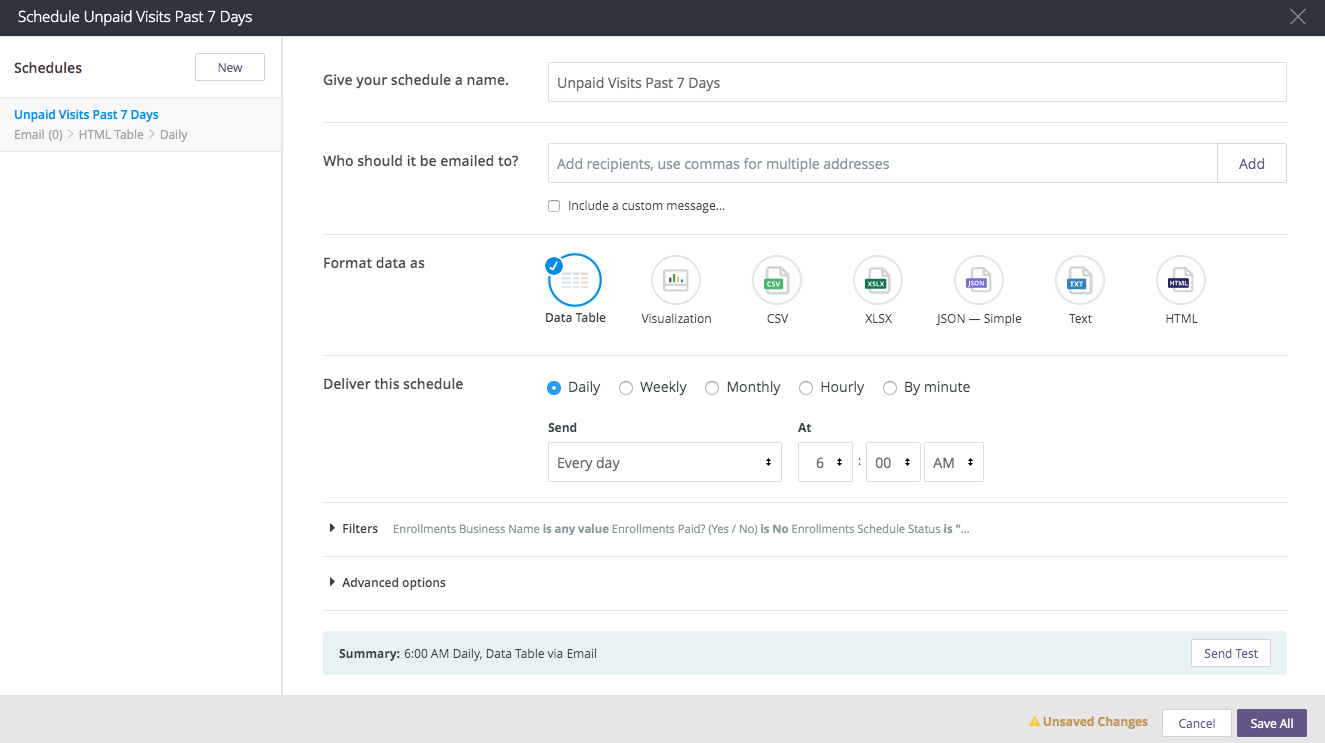
After starting a schedule, Looker displays a dialog box with your scheduling choices. The screen below shows an example schedule dialog box for a dashboard:
The left panel shows all schedules created for this content and highlights the title of the schedule you are creating or editing. If this is the first schedule you’re creating for this content, the main panel displays scheduling options set to their default values. You can modify those values as desired. If you have previously created one or more schedules for this content, the main panel displays its saved scheduling settings. Then:
To edit an existing schedule’s options, select that schedule and change the options as desired. When you are done, click Save All.Note
By default, the first schedule is selected and any changes made will overwrite that schedule.
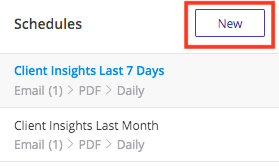
- To create additional schedules for the same content, click New + and enter the settings for that additional schedule. When you are done, click Save All.

Naming the Schedule
Give the schedule a unique title in the Give your schedule a name field. The title is used for the email's subject line, and as part of the file name if you select a format that uses an email attachment.
Sending to Email
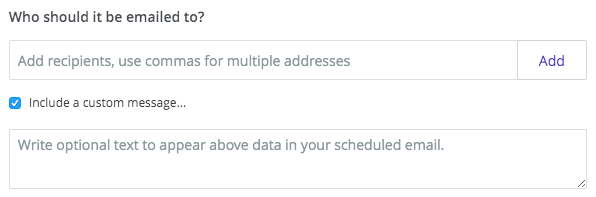
In the Who should it be emailed to section, enter the email addresses of the recipients. Enter a single email address, or multiple addresses separated by commas, and click Add.
Click Include a custom message to add a customized message in the body of the email.
Choosing a Data Format
In Format data as, choose the format for the data in your delivery.
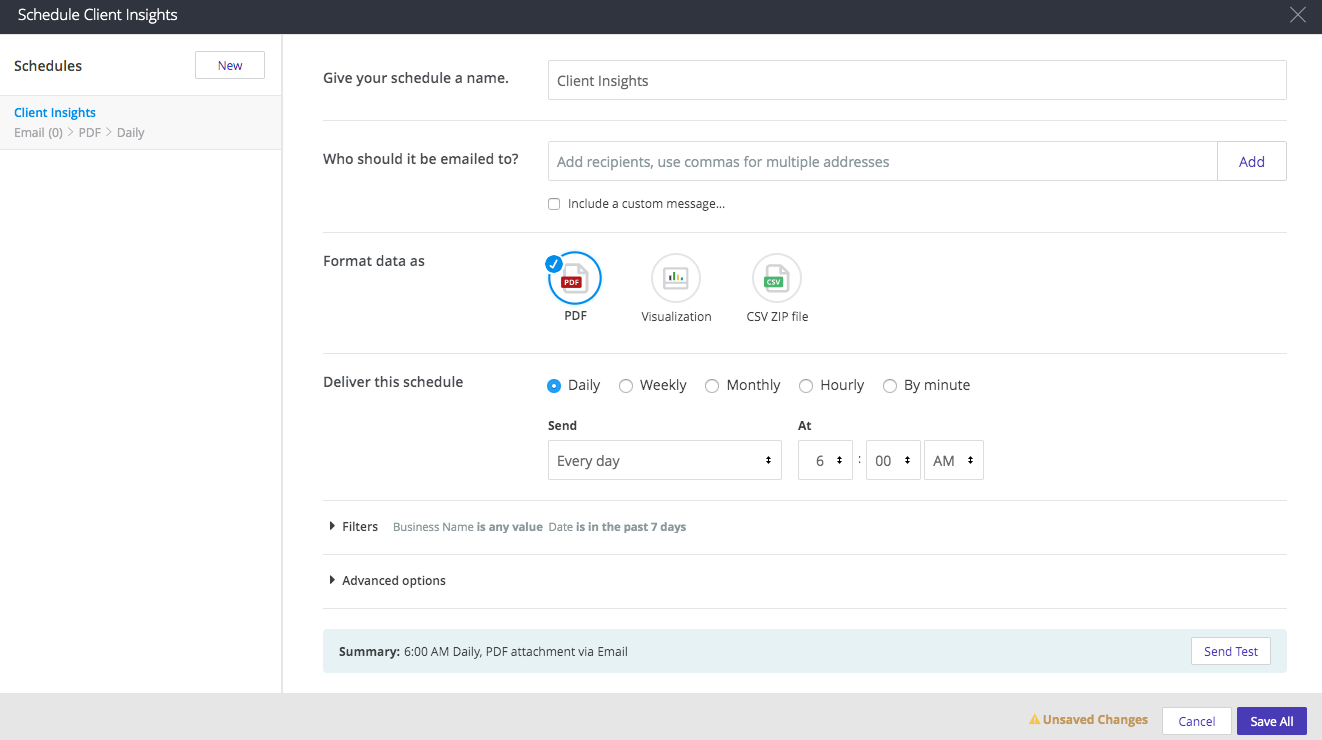
For dashboards, you can choose:
- PDF: Your dashboard as a PDF attachment. The default layout displays tiles as they are arranged in the dashboard, but other layouts and sizing options are available under Advanced Options.
- Visualization: A visualization of your dashboard in the body of the email in a single image file. The default layout displays tiles as they are arranged in the dashboard, but other layouts and sizing options are available under Advanced Options.
- CSV ZIP File: The unformatted data from your dashboard, delivered as a collection of comma-separated values (CSV) files in a zipped directory.
For Looks and Explores, you can choose:
- Data Table: The data table in the body of the email in HTML.
- Visualization: A visualization of your data in the body of the email as an image.
- CSV: The data table as a comma-separated text file attachment.
- XLSX: The data table as an Excel file attachment.
- JSON — Simple: The data table as a JSON file attachment.
- Text: The data table as a tab-delimited text file attachment.
- HTML: The data table as an HTML file attachment.
Timing the Schedule
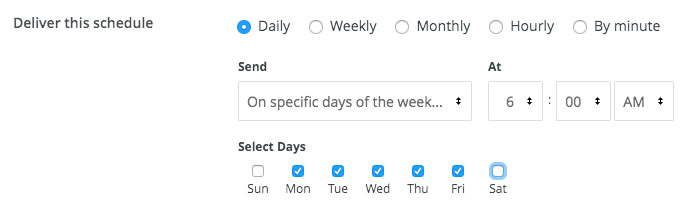
Customize the timing of your schedule in the Deliver this schedule section. The timing options change depending on whether you choose Daily, Weekly, Monthly, Hourly, or by Minute. You can adjust the time zone for the schedule in Advanced options section.
Applying Filters to the Delivery
If you are delivering a Look or dashboard that has filters, you can filter the results delivered to each set of recipients. For example, you might send all the active passes and plans.
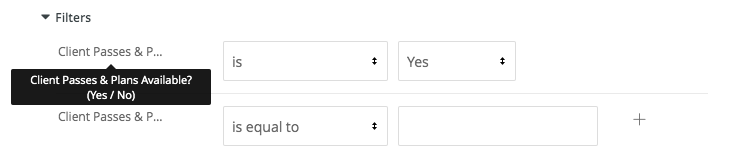
Click Filters to see and modify the filters associated with this Look or dashboard for your data delivery. Changing these filter options in the Send or Schedule window does not change the filters in your Look or dashboard.
Using Advanced Delivery Options
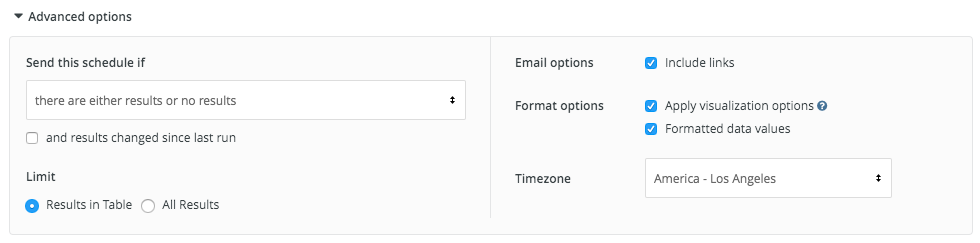
The Advanced options section provides additional customization for your schedule. Click the arrow next to Advanced options to expand this menu.
Scheduling Conditions
For all Look formats other than Visualization, you can add conditions for when the data will be delivered:
- Send this schedule if: You can send the data only if there are results, only if there are no results, or in either case. With this option, you can send data deliveries only when the filters of your Look are met (or not met). For example, you can create filter conditions for situations you want to monitor, such as invoices that past due.
- and results changed since last run: This option cuts down on unnecessary data deliveries. Looker sends the data only if the query results have changed since the last data delivery was sent. This option is not available if you want to use the All Results limit option.
Scheduling Limits
When sending Looks and Explores, you can limit the size of your email to stay within your email server's message size limitations. Select one of the following limit options for your data:
- Results in Table: Data is sent with a 5,000 row limit. This is the only choice available for emails using the Data Table or Visualization format options. Emails with over 5,000 rows will not be sent.
- All Results: If you are using the Text, CSV, JSON — Simple, XLSX, or HTML format options, you can send all of the rows of the results of a saved Look. This option ignores any limits set on a saved Look or Looker's typical 5,000 row limit. There is, however, a total data limit of 15 MB so that email applications will accept the attachment. Emails over 15 MB will not be sent. If you specify a Data Table or Visualization format and then select All Results, Looker automatically changes the format to use a Text attachment to support sending all results.
To verify that you are within the row or data limit for scheduled emails, you can enter your own email address as the recipient and click Send Test to send the data to yourself immediately. If you do not receive the email, it is likely that you have reached the row limit or the data limit for emails.
Limit options are not available when you send a dashboard. Dashboard query limits depend on the data delivery format:
- CSV zip files will include as many rows as the underlying query specifies, up to a 5,000 row limit.
- PDF and visualization formats show a static image of each tile at the time it was run. In the case of a tile showing a table visualization, you will see however many rows were visible in the tile when the file was rendered, and you will not be able to scroll the tile.
Format Options
The following options are available when sending data delivery over email.
Apply Visualization Options
For Looks, Explores, and CSV-formatted dashboards, you can configure whether you want the data delivery to use the same options as your visualization:
Select Apply visualization options to apply some of the visualization settings to your delivery, causing your delivery to appear similar to a table chart. Any of the following settings in the Plot, Series, and Formatting menus that are configured for the visualization will be applied to the data delivery:
- Show Row Numbers
- Hide Totals
- Hide Row Totals
- Limit Displayed Rows to a maximum of 500 rows shown or hidden.
- Show Full Field Name
- Custom labels for each column (note that JSON files will always use raw field names, not the field label)
- Conditional Formatting for deliveries of table chart visualizations in Excel format
Unselect Apply visualization options if you do not want these visualization options applied. Looker sends the data as it appears in the Data section of the Look or a dashboard tile's Explore from Here window.
Formatted Data Values
For Looks, Explores, and the CSV format of dashboards, you can configure the data's formatting:
Select Formatted data values if you want the data to appear more similar to the Explore experience in Looker, although some features (such as linking) aren't supported by all file types.
Unselect Formatted data values if you do not want to apply any special formatting of your query results, such as rounding long numbers or adding special characters your Looker developers may have put in place. This is often preferred when data is being fed into another tool for processing.
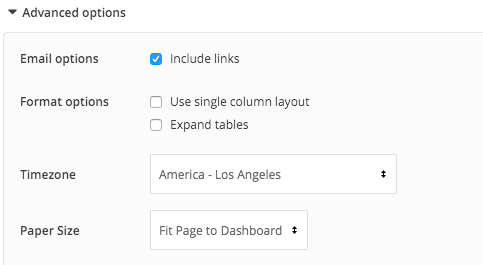
Single Column Layout
For dashboard deliveries in PDF or Visualization format, you have the option to print your PDF in a single column layout, which displays dashboard tiles in a single vertical column. Check the Use single column layout box to use this option, or leave the box unchecked to show the tiles as they are arranged in the dashboard.
Expand Tables
To display all rows of a data table — rather than just those rows that display in the dashboard tile thumbnail — in a PDF dashboard delivery or download, check the Expand tables box.
Timezone
By default, Looker will use the time zone associated with your account to determine when to send your data delivery. If you don't have a time zone associated with your account, Looker will use your Application time zone. If you want to specify a different time zone, select Use custom timezone. The time zone you select does not affect the data in your Look or dashboard, just the timing of the delivery.
Paper Size
You have the option to specify the optimal size and orientation of dashboard PDFs by selecting from the Paper size drop-down menu. Large visualizations or groups of overlapping dashboard tiles may need to be resized to fit cleanly on a PDF page.
Testing Your Schedule
Click the Send Test button to send a one-time test delivery to the specified destination.

Managing Schedules
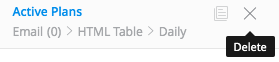
Each saved Look or dashboard can have multiple schedules, and each user of that data has their own set of schedules. If a user edits or deletes one of their schedules, only their recipients will be impacted; other users might have other schedules related to that data.
Data formats available for scheduling will differ depending on whether you are scheduling delivery of a Look or a dashboard.
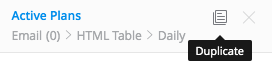
Creating Additional Schedules
If you want to create another schedule for the same content, click New +, change the new schedule’s default name (if necessary), and specify its scheduling options. Your schedules are listed by title in the left panel of the schedule dialog box.
Saving Your Schedule
When you are finished creating schedules for this content, click the Save All button to save your schedule and close the window.