This guide explains how to use the Looker Explore tool to build custom reports, visualize trends, and dive deep into your Pike13 data.
In this article
Who can use this feature?
- Pike13 Plans: ✅Premium, ❌Advanced, ❌Essential
- User Roles: ✅Primary Owner, ✅Owner, ✅Manager, ❌Staff, ❌Limited Staff
Where to Start?
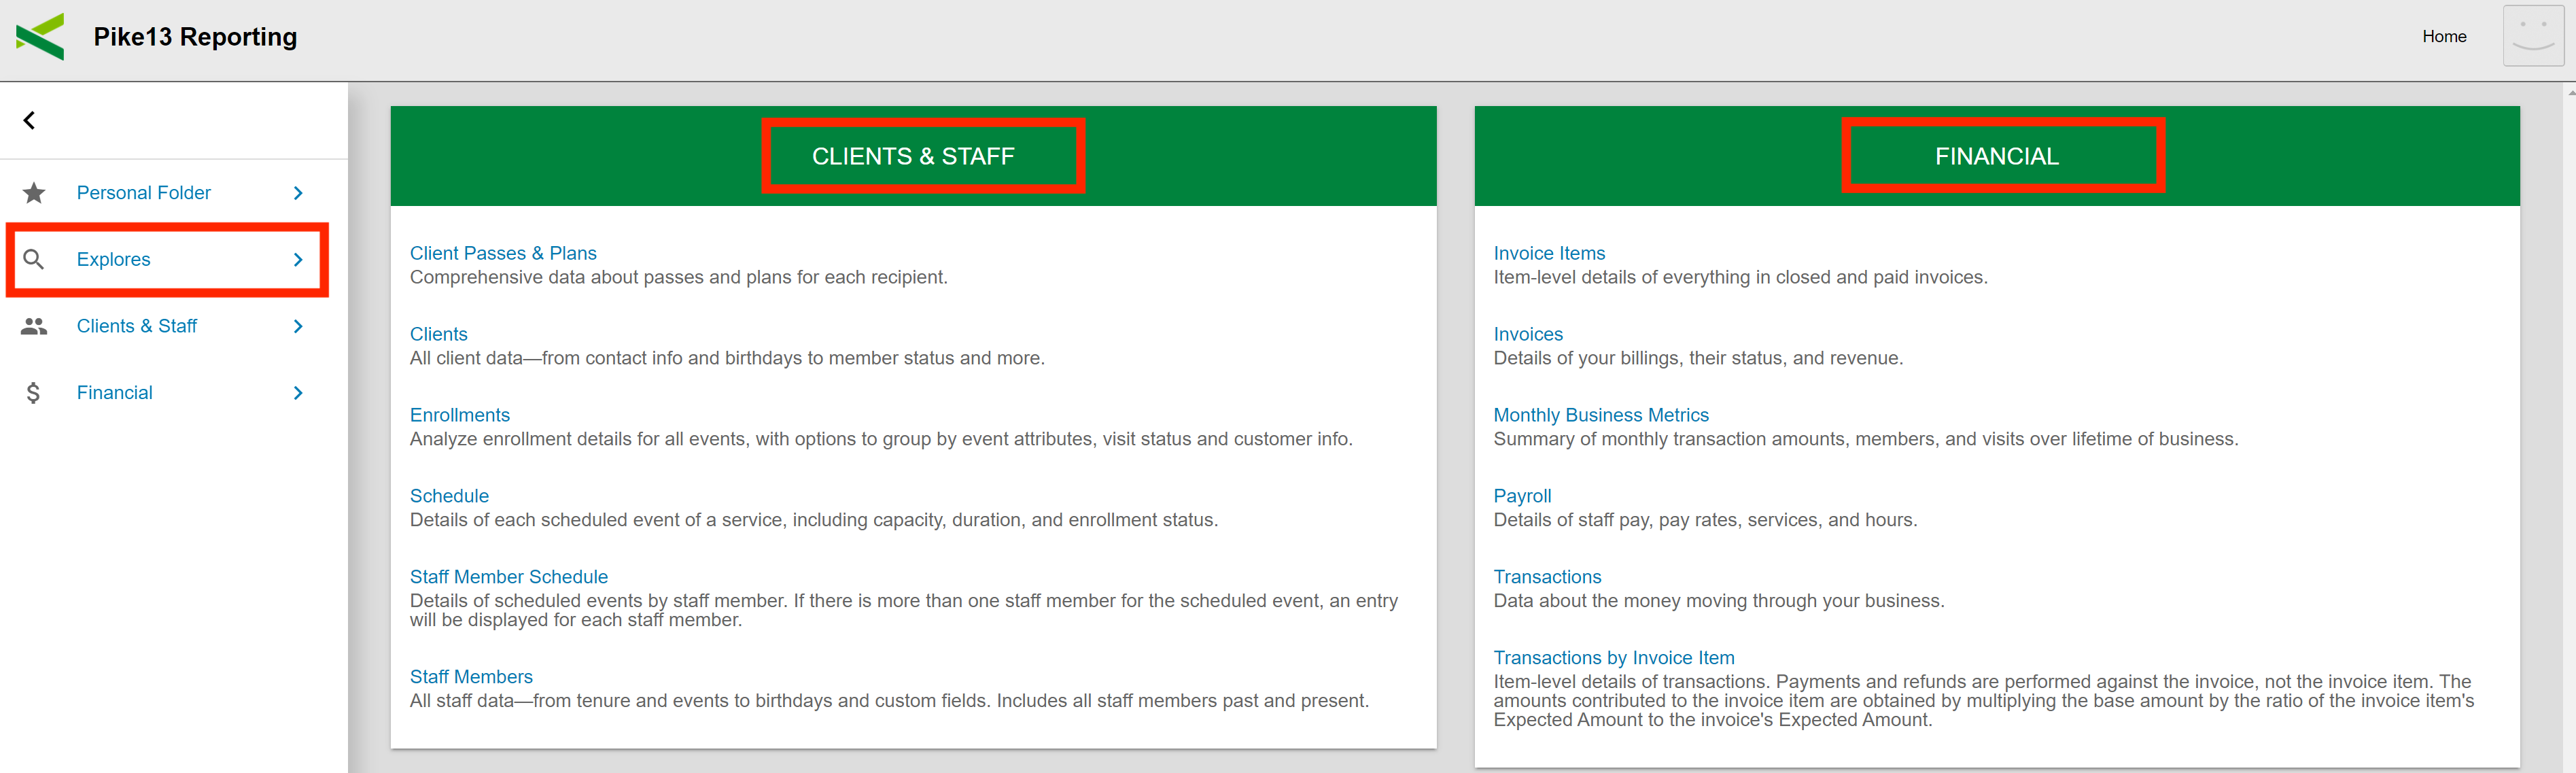
There are three ways to enter the "Explore" view:
The Explores Tab: On your reporting landing page, select Explores from the sidebar. Choose a subject area like Clients & Staff (enrollments, profiles) or Financial (transactions, payroll).
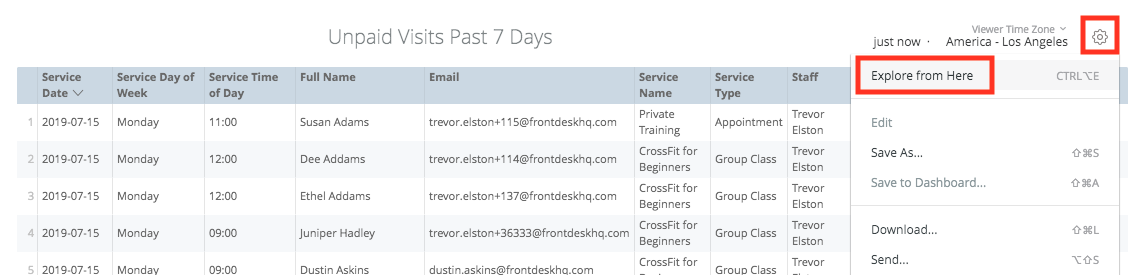
From a Look: Click the Gear Icon on any saved Look and select Explore from Here.
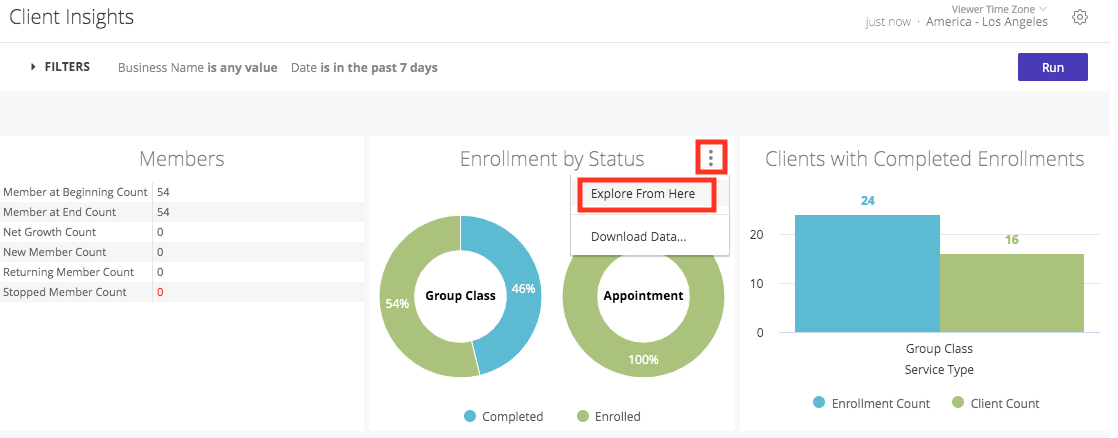
From a Dashboard: Hover over any dashboard tile, click the Three Dots (⋮), and select Explore from Here.
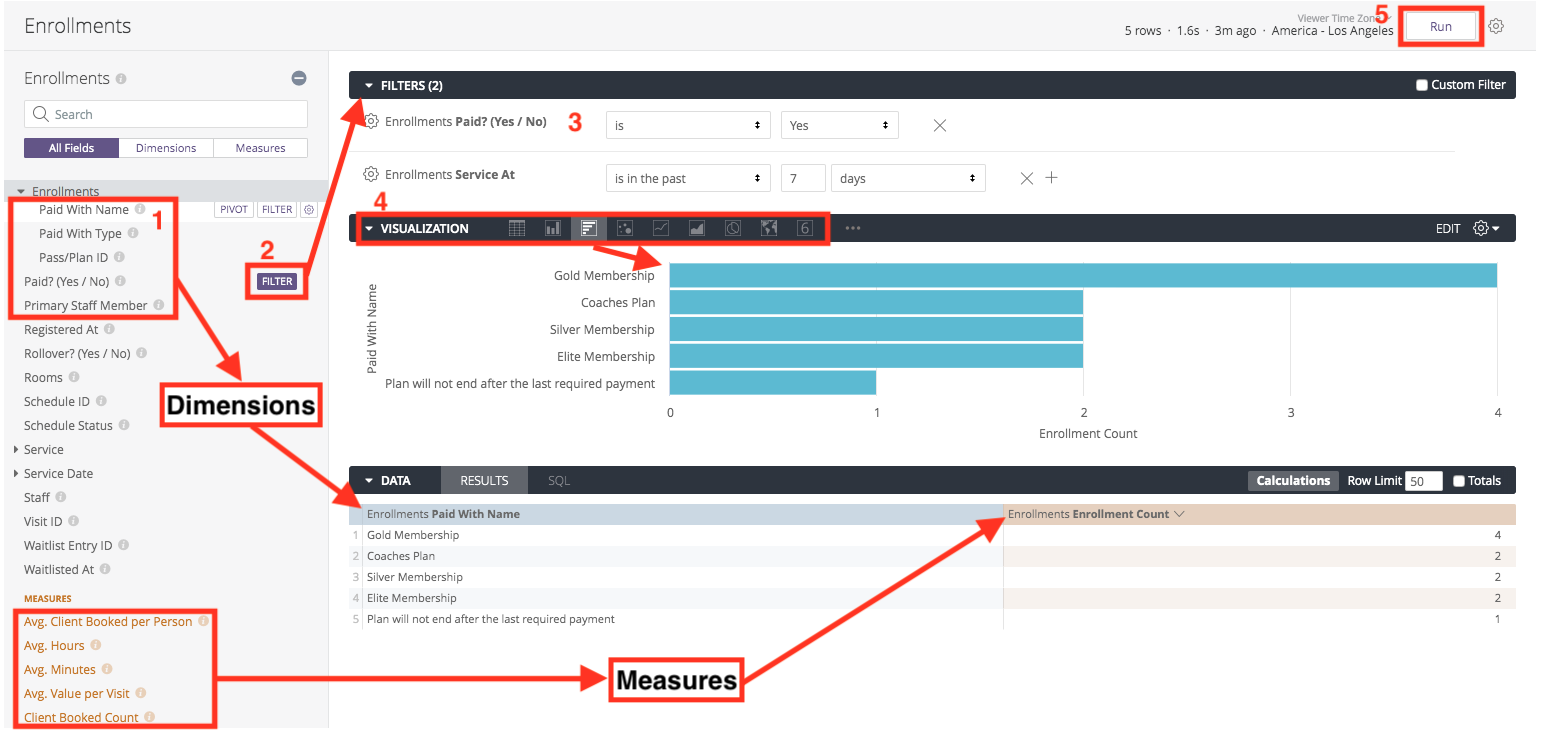
The Basics: Dimensions vs. Measures
Think of an Explore as a sandbox where you mix and match data fields:
-
Dimensions (Grey): These are categories used to group your data (e.g., Client Name, Date, or Plan Type).
-
Measures (Orange): These are quantitative values like totals, counts, or averages (e.g., Enrollment Count or Total Revenue).
To build a quick report:
-
Select your Dimensions and Measures from the left panel.
-
Click Filters to narrow your results (e.g., "Date is in the last 30 days").
-
Choose a Visualization style (Bar chart, Table, Pie chart, etc.).
-
Click Run to generate the data.
Organizing Your Data
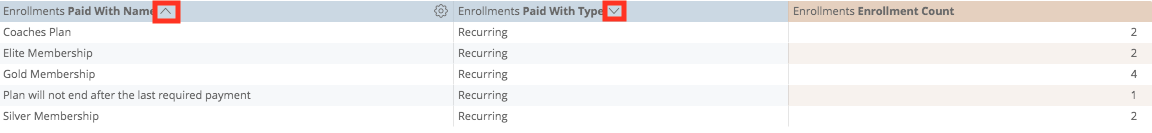
Sorting - Click any column header to sort alphabetically or numerically. To sort by multiple columns, hold the Shift key while clicking headers.
Moving Columns - Click on a column header and moving the column to its desired position. The Explore’s visualization will reflect the new column order after you click Run.
Pivoting (Horizontal Grouping) -If your table is too long, you can "Pivot" a dimension to turn its values into horizontal columns by clicking PIVOT next to a dimension name..
NOTE
You must have at least one unpivoted dimension and one measure for this to work.
Note: You must have at least one unpivoted dimension and one measure for this to work.
Move Columns: Click and drag a column header to a new position.
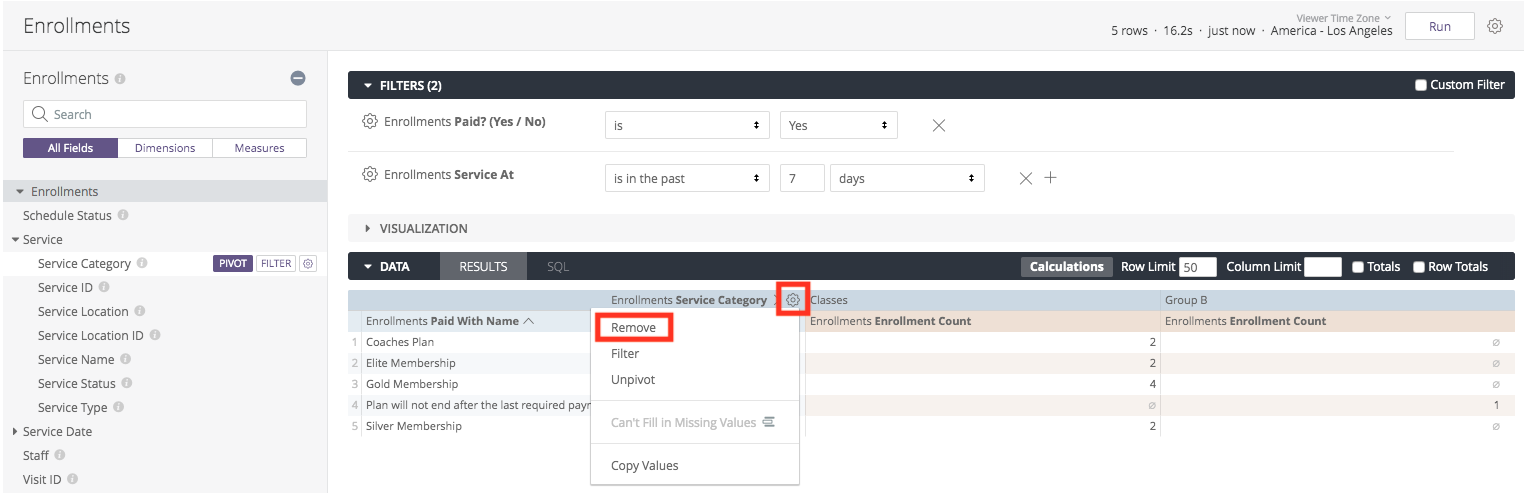
Remove Fields: Click the selected field in the left panel or click the Gear Icon on the column and select Remove.
TIP
Use Ctrl+K (Windows) or Cmd+K (Mac) to clear all fields and start over.
Warning If you happen to reach a row limit, you will not be able to sort row totals or table calculations.
Summarizing Data
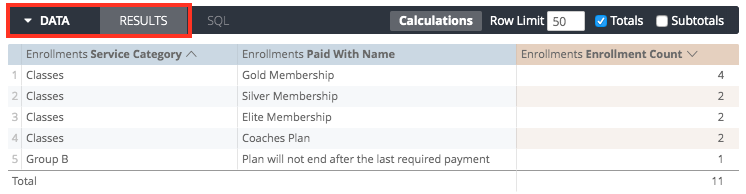
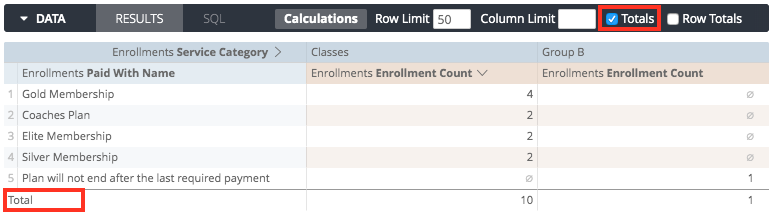
You may find it useful to summarize your data. You can add column totals to your report by clicking the Totals checkbox in the upper right, then running the report.
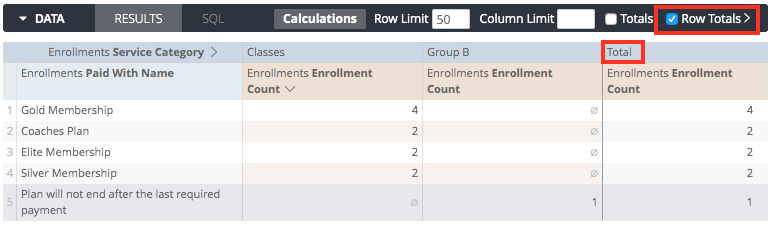
You can also add Row Totals to your report, but only if you’ve added a pivot to your report:
When your report hits a Row Limit, sorting by Row Totals is disabled. This is because the total represents your entire dataset, but the report is only showing a partial slice of it. To fix this, increase your row limit (up to 5,000) to include more data.
You cannot add totals to every column. Restrictions include:
-
Measures Only: Totals only work for numerical Measures (like revenue or counts), not Dimensions (like names or categories).
-
Logic Constraints: Some data cannot be summed (e.g., you cannot "total" a list of words or certain database-restricted fields).
Totals in Looker sometimes look "wrong" at first glance. Here is why:
-
Unique Counts: If you are counting "Unique Clients," a person appearing in two different categories is only counted once in the final total.
-
Calculations: Percentiles and medians are calculated based on the data in the total row itself, not by adding up the numbers above it.
-
Filters & Limits: If you filter by a measure or set a row limit, the total often reflects the entire dataset before those filters or limits were applied. This makes the total appear higher than the sum of the visible rows.
TIP
Totals for "Visible Data Only"
If you want a total that only adds up what is currently visible on your screen, use a Table Calculation:
-
For Columns:
sum(${view_name.field_name}) -
For Rows:
sum(pivot_row(${view_name.field_name}))
It is possible to calculate totals only for the data you can see. To do so, you’ll need to use a table calculation, explained later in this tutorial. For a column total use sum(${view_name.field_name}). For a row total use sum(pivot_row(${view_name.field_name})).
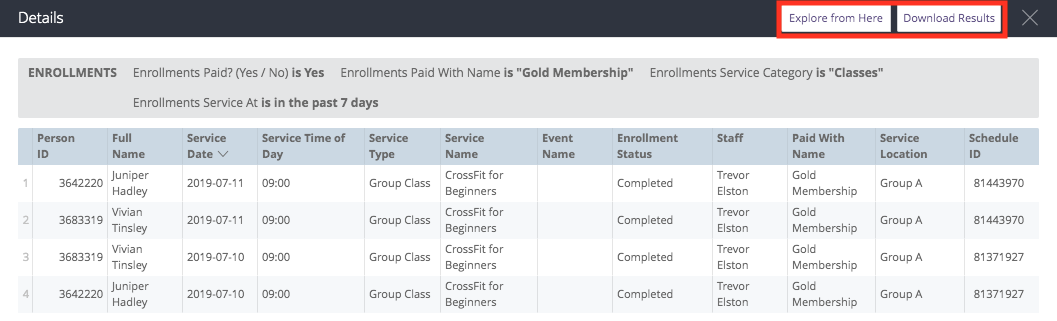
Drilling Down for Details
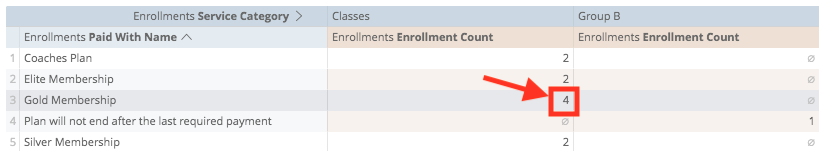
Every number in a Looker report is interactive.
-
Click any value (e.g., the number "4" in a enrollment count) to see exactly which clients or sessions make up that number.
-
Navigate to Pike13: Within a drill-down list, click a client’s Full Name to open their profile directly in your Pike13 site.
-
Download: You can download the specific data from a drill-down by clicking Download Results.
- Click the Explore from Here button to open an Explore that uses the fields in the drill overlay as a starting point.
- Click the Download Results button to download the data, using the same options as shown on this page.