Now that you’ve learned how to find the content, this tutorial will show you how to view, filter, and drill into saved reports (Looks) in your Pike13 reporting suite, including time zone adjustments and mobile tips. You can view, click, and explore these Looks as much as you want without affecting other users.
Note
The only way to permanently change a report for everyone else is if you click the Edit button and save changes. If you are just viewing and clicking, you are in a "safe zone."
Once you’ve mastered viewing Looks, learn more about exploring and creating visualizations.
Opening a Look
-
Navigate to a Reporting Folder you have access to.
-
Click the Title of the Look you want to view.

Making Sense of a Look
When you view a Look you’ll see the following items:
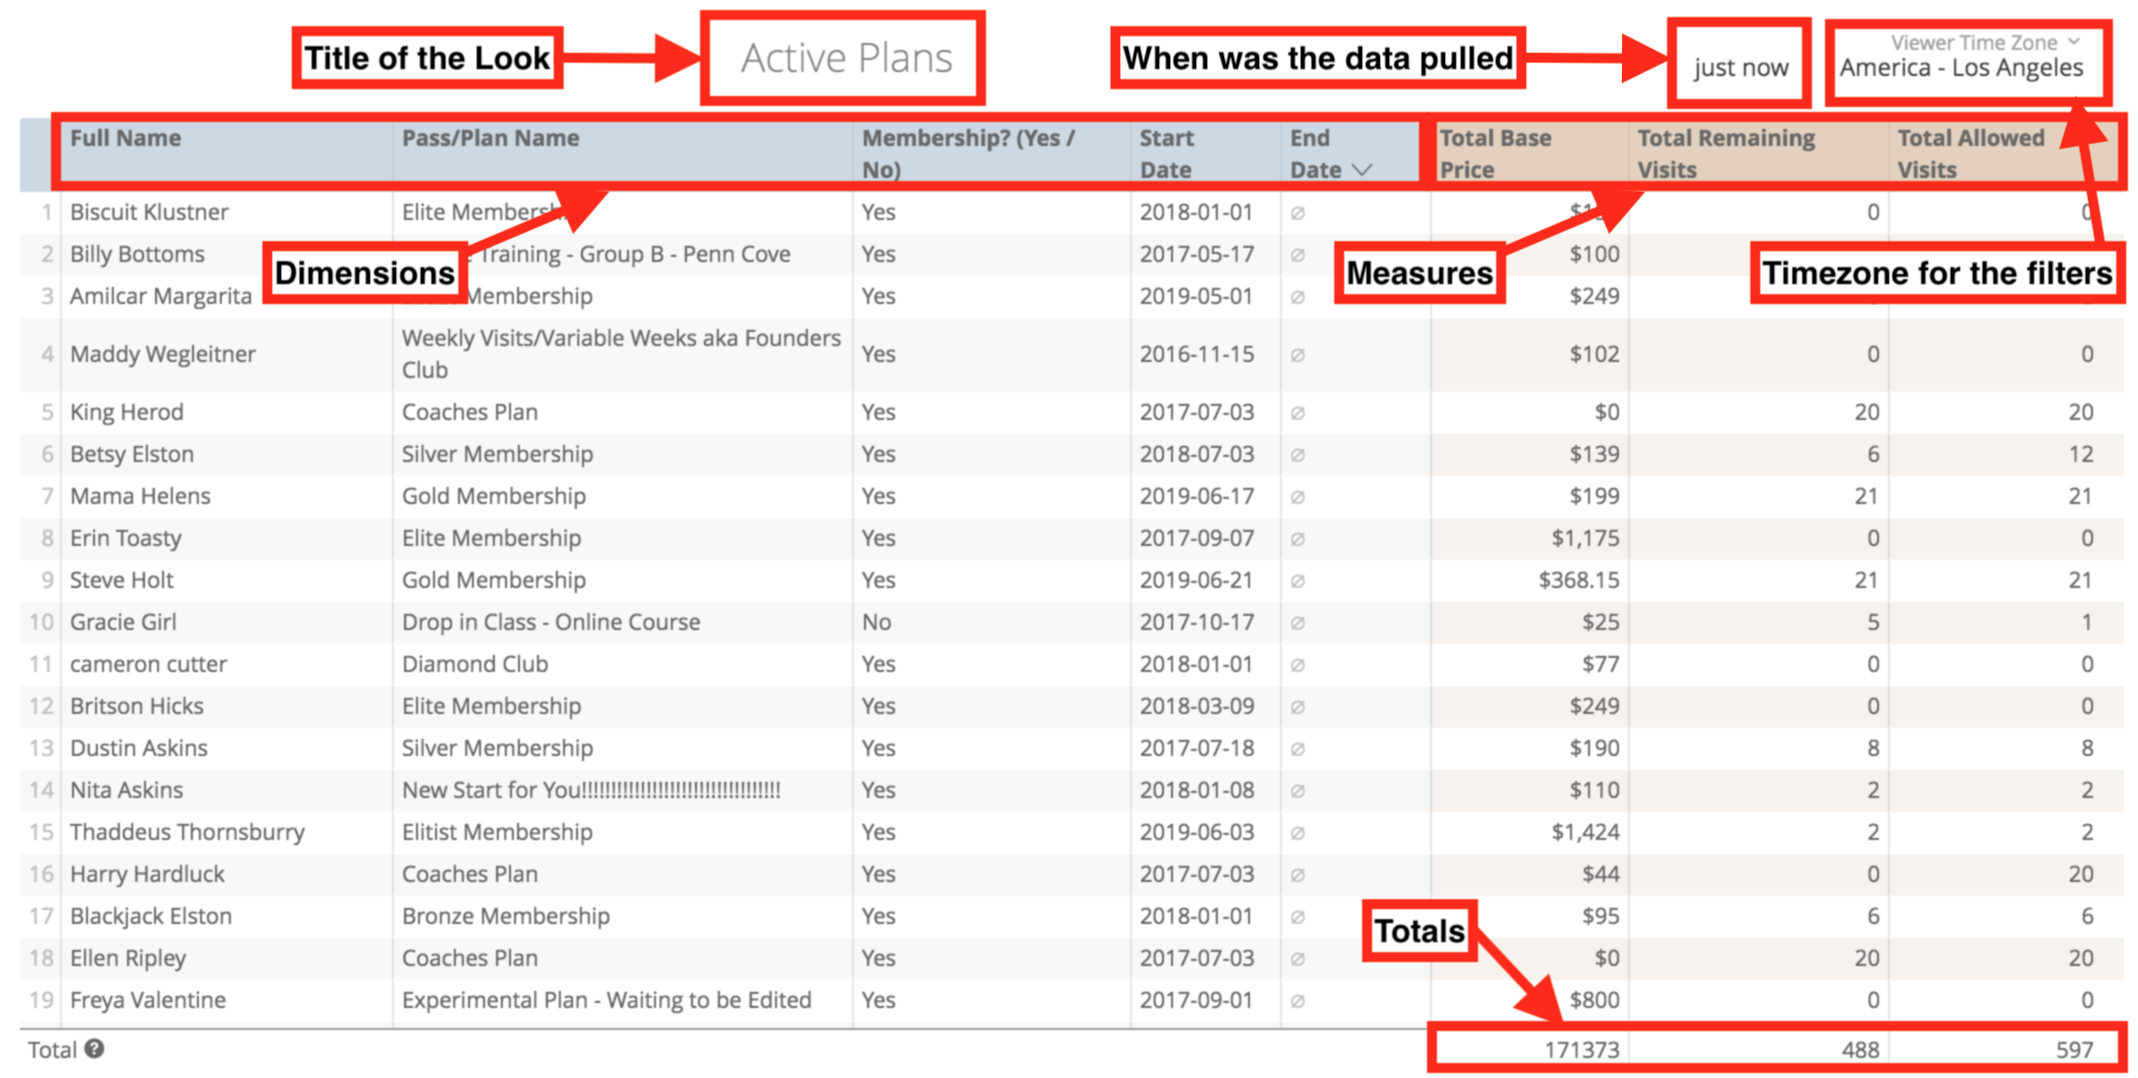
- The title of the Look.
- How long ago the data was queried (to display the date and time, hover over the relative time information).
- The time zone of the data you’re viewing.
- The chart associated with the Look’s data.
As you gain familiarity with Looker you’ll begin to use saved Looks as a launchpad for further exploration. You can start with one set of data and then begin exploring the answers to related questions by changing the filters, changing the visualization, sorting the data differently, or making other changes. You can learn about these exciting possibilities in our exploring data tutorial.
Choosing Time Zones
If you need to view data in a different time zone (which affects filters like "Today" or "Yesterday"):
-
Click the Time Zone displayed in the upper right corner.
-
Select the new time zone from the dropdown.

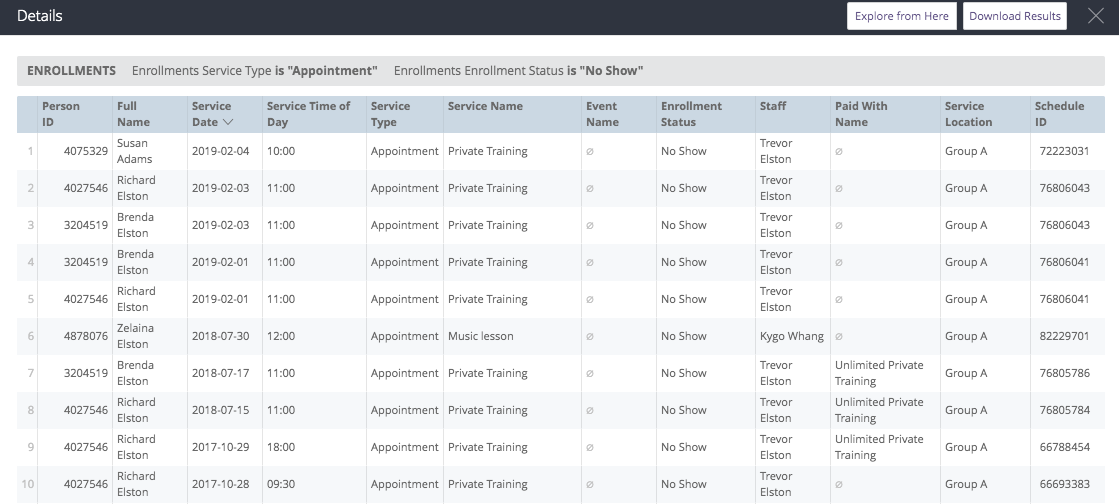
Drilling into Data (The "Details" Window)
You can drill into a value on your report. Example: If you see a column for "Total Remaining Visits" with the number 20, you can click on the 20.
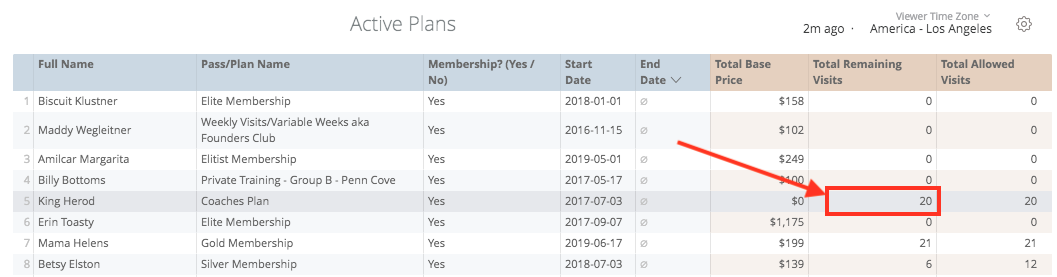
Result: A "Details" window will pop up listing exactly which client passes make up those 20 visits.
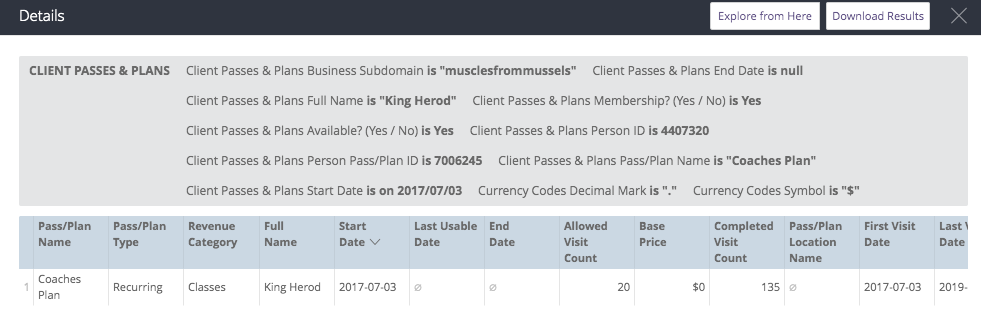
For datasets where the row limit is reached in the Details window, Looker provides a link at the top of the window to Download Results so you can view the full list in Excel/CSV. Click the link to download the data, using the same options as shown on this page.
Drilling into Visualizations (Charts)
You can also drill down directly from a graph or chart.
- Hover your mouse over a bar or pie slice to see a quick summary of that data point.
- Click on the data point (e.g., the "Appointment No Show" bar).
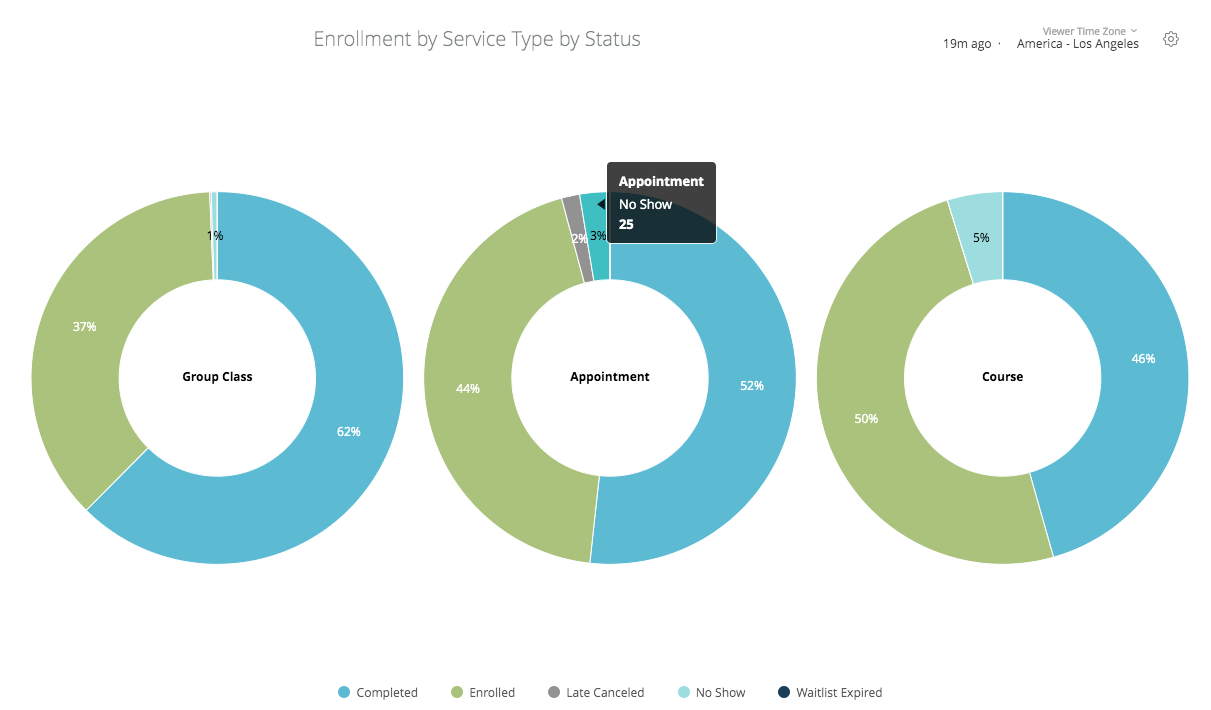
- Result: A new list will appear showing the specific data (e.g., the 25 specific appointments that were No Shows).
Viewing Visualizations on Mobile Devices
When viewing reports on a touchscreen device, use these gestures:
-
Tap: Tap a data point on a chart to show summary info.
-
Press & Hold: Press and hold a data point to Drill into the data behind it.
-
Press & Drag: Drag your finger across a chart to see information about each data point as you move over them.
Conclusion
You now know how to view and understand existing Looks. If you’d like to learn how to create your own reports, check out our Exploring Data in Looker page.
Otherwise, in the next section you can learn how to view and use existing Dashboards.