Once you’ve found the content you’re looking for, you can view that content and make non-permanent changes to it, like filtering the data or changing a time zone. You can view and click on dashboards and Looks without impacting anyone else — unless you choose to edit something, make changes, and then save them.
This documentation page explains how to use the dashboard in other ways, such as downloading the dashboard or using the dashboard to start exploring your own related questions. See the Viewing Looks documentation page for a similar rundown on viewing Looks. Learn more about browsing and exploring data before starting to edit Looks or edit dashboards.
Dashboard Introduction
In our Reporting suite (Looker), a Dashboard is a collection of various reports (visualizations, text, and data tables) displayed together on a single page like tiles.
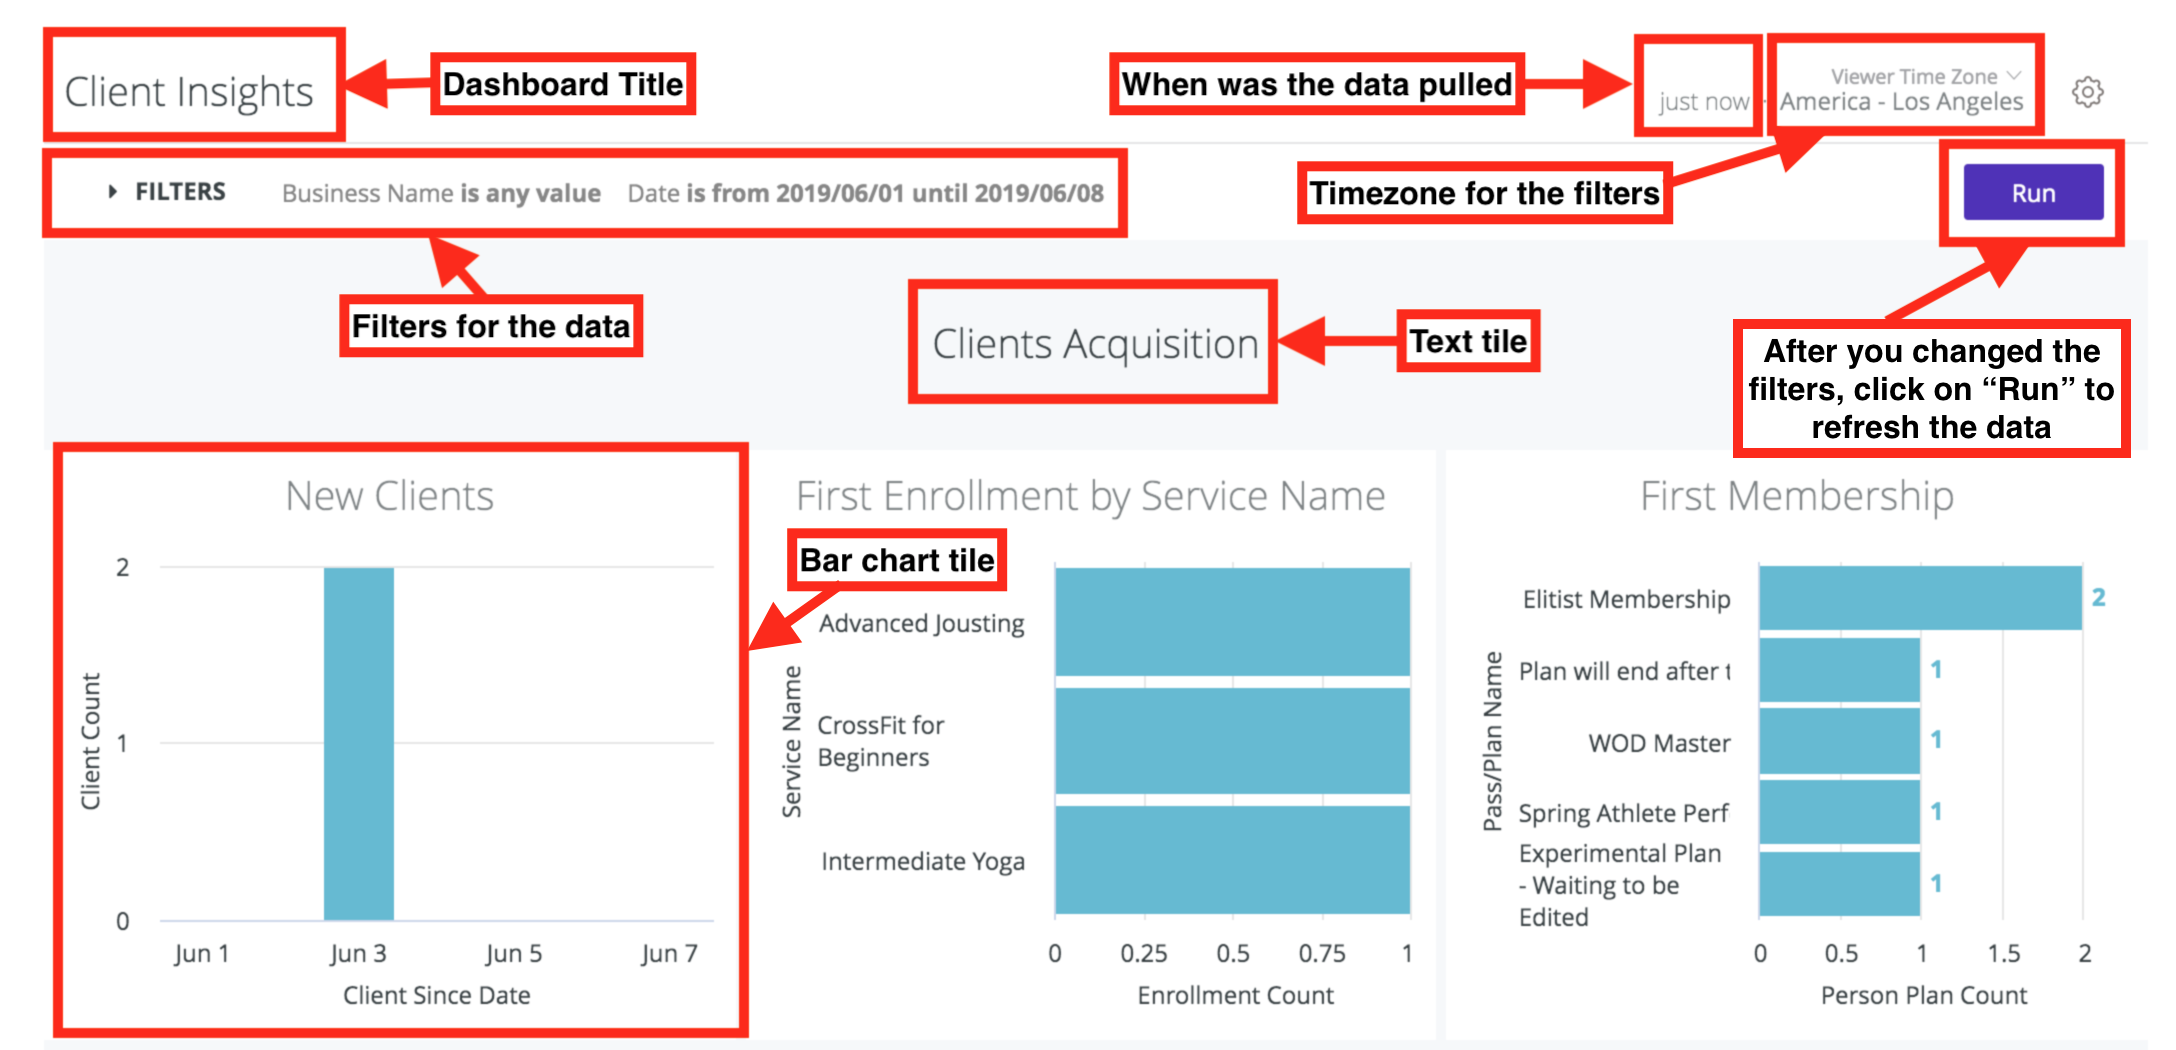
Dashboards can be made up of tiles based on text, saved Looks, or queries specific to that dashboard.
To view a dashboard, navigate to the folder that contains the dashboard and click on the dashboard’s name. To learn more about creating and managing your own dashboard, see our Creating User-Defined Dashboards page.
Opening a Dashboard
To open a saved dashboard:
-
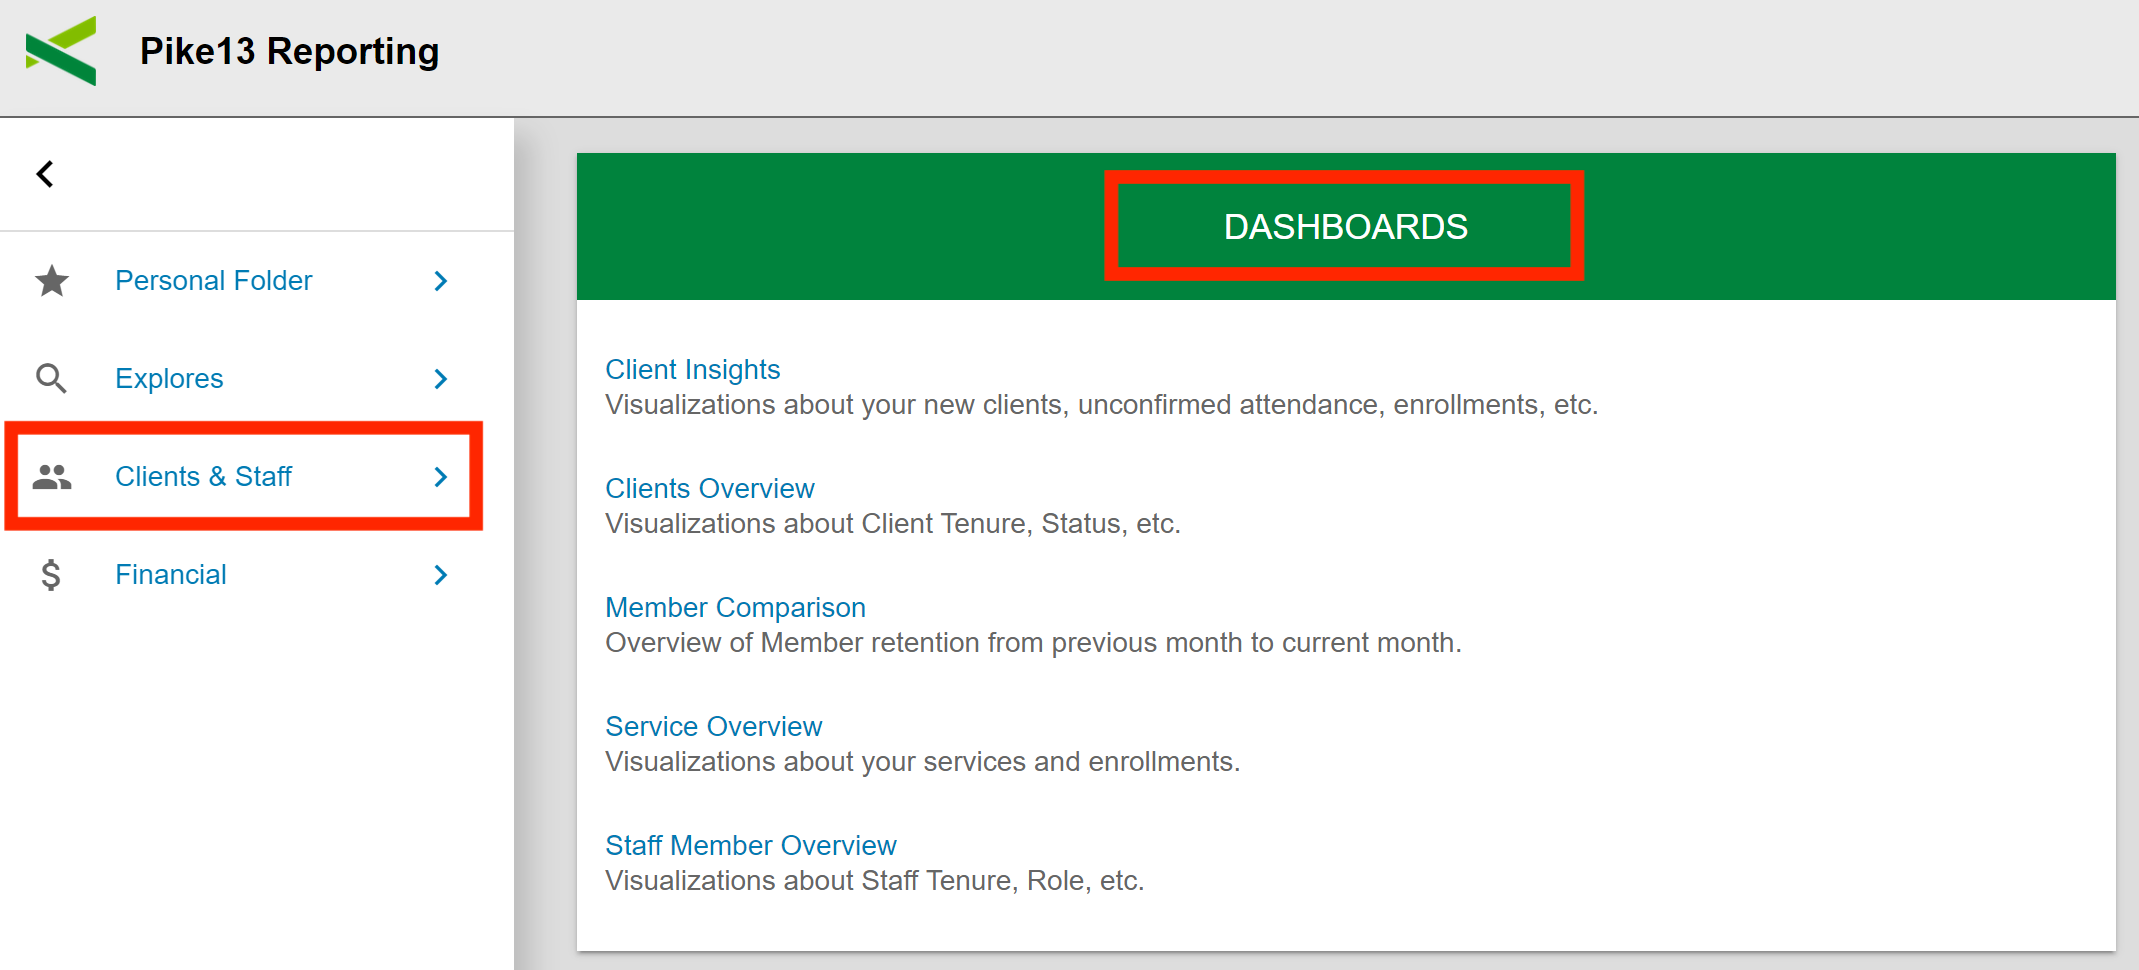
Navigate to a Reporting Folder you have access to (e.g., "Clients & Staff").
-
Under the Dashboards section, click the Title of the dashboard you want to view.
Making Temporary Changes to a Dashboard
You can make some types of temporary changes to a dashboard without affecting anyone else, such as changing the time zone. If your dashboard has filters, you can also change the filter values to restrict the dashboard to certain types of data.
To save these changes for other users, see the Editing Dashboards documentation page.
Changing Dashboard Filter Values
Looker dashboards can have one or more filters that affect one or more of the tiles. For an overview of the kinds of filters available in Looker, see the Filtering and Limiting Data documentation page.
On the dashboard, you can change filter values to see how the data changes. You will not affect anyone else by changing the filter unless you edit and save the dashboard. If one or more tiles do not update when you change the filter value, the filter may not apply to those tiles unless the dashboard is edited.
For example, dashboards often have a filter that specifies the date ranges to include. You can see the filter by clicking the Filter section:
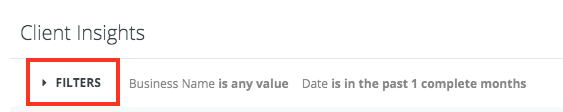
Then you can use the drop-down menus to change the filter choices as desired:
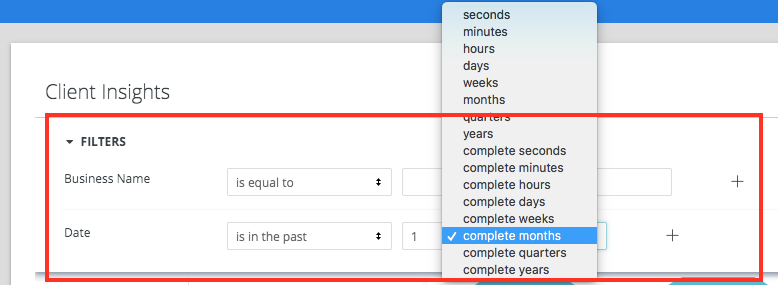
In the drop-downs, one of the choices is matches (advanced), which enables you to use advanced filtering choices.
Configuring a Dashboard Time Zone
The time zone applied to your dashboard can affect the results shown, due to slight differences in the exact hours used for time-based data. Because of this, you may want to change the time zone of your dashboard if you are interested in the data as it applies to a different region.
You can use the time zone drop-down menu to specify the time zone in which a dashboard is run:

You can choose one of the following options:
- Each Tile’s Time Zone to have all tiles run in the time zone in which they were saved.
- Viewer Time Zone to have all tiles run in your user’s dashboard setting.
- Any of the time zones listed in the drop-down to have all tiles run in that time zone.
Once you navigate away from the dashboard, your time zone will return to the default time zone assigned to your Looker account.
Refreshing Data in a Dashboard
Looker dashboards aren’t static snapshots of data from a specific time. Looker dashboards pull data from your live database when you load the page. Typically, Looker has access to the data as fast as the data reaches the database.
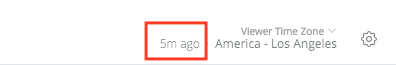
The top right of your dashboard shows how recently the data was retrieved:
Scheduling Dashboard Data Delivery
Looker lets you schedule periodic delivery of your dashboard to email recipients or to other data destinations. See the Scheduling Data Deliveries documentation page for more information.
Sending Your Dashboard Immediately
Looker lets you send a dashboard immediately in an email to yourself or other people, or send the results to another data destination. See the Sending Data Now documentation page for details.
Downloading Your Dashboard (CSV, PDF)
Looker lets you download your dashboard so that you can store or share the current data. You can download the dashboard as a zipped collection of CSV files or as a PDF.
- Click the Gear Icon (three dots) in the upper right corner of the page.
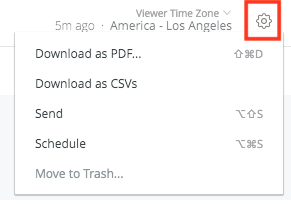
- Select your preferred format:
-
-
Download as CSVs: Creates a zipped folder containing a separate spreadsheet for every tile on the dashboard.
-
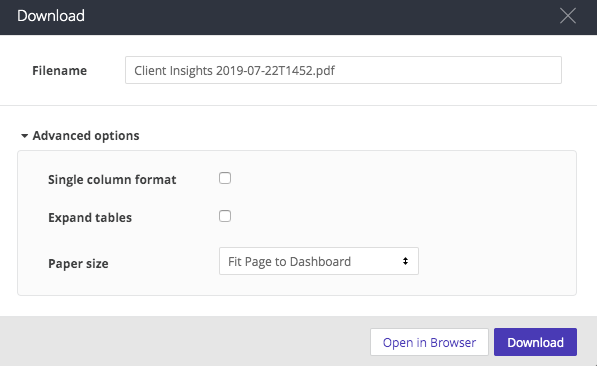
Download as PDF: Creates a visual document of the dashboard. You can choose "Single column format" for easier reading.
- Optionally, use the Filename box to change the name of the PDF file.
- Optionally, expand the Advanced options menu to further customize your PDF.
- Then check the Single column format box if you want the PDF to show the dashboard tiles in a single vertical column. Leave the box unchecked if you want the PDF to show the tiles as they are arranged in the dashboard.
- You also have the option to specify the optimal size and orientation of your PDF by selecting from the Paper size drop-down menu. Large visualizations or groups of overlapping dashboard tiles may need to be resized to fit cleanly on a PDF page. If you do not see the Paper size option, talk to your Looker admin about installing the Chromium renderer for your Looker instance.
-
Downloading Data from Dashboard Tiles
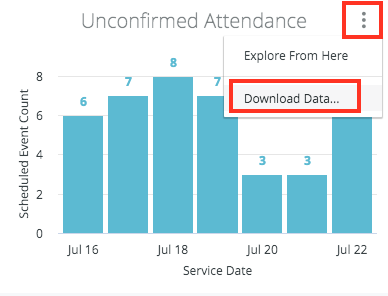
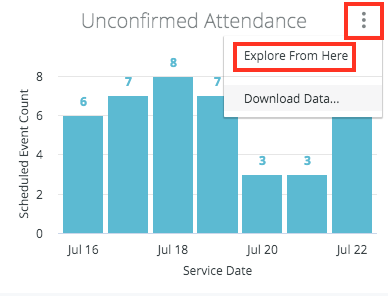
To download the data from a specific tile, click the three-dot icon and select Download Data:
See the Downloading Data documentation page for more information about the options available to customize your data download.
Exploring the Data Used in a Dashboard
Dashboards are also starting points for further exploration. You can click the title of a tile to explore its underlying data, or you can select Explore From Here from the tile’s menu:
Once you arrive at the Explore page, you can continue to adjust the query for your particular interest.
You also can click or hover on some elements in the dashboard tiles (such as a slice of a pie chart) to view more details about the data. You can learn the skills to explore the details of a dashboard’s data on the exploring data pages.
Viewing Visualizations on Mobile Devices
When viewing a dashboard tile visualization on a mobile device, Looker has the following touch options to make it easier to view information about your data:
- Tap a data point on the visualization to show information about that data point.
- Press and hold a data point to drill into the data behind the data point.
- Press and drag across the visualization to show information about each data point as you move over them.
Conclusion
Now that you know how to view and use dashboards, see this page to learn how to create your own dashboards and add tiles to them.
Or, continue to the next tutorial to learn how to download data in Looker.